Tutorial 2: Analysis#
A simulation checkpoint file may be loaded for analysis and visualization.
To load the last checkpoint from a simulation, specify the checkpoint directory
when creating the Simulation object:
import jaxion

# load the simulation
sim = jaxion.Simulation("checkpoints/")
Or, to load a specific checkpoint, specify the checkpoint directory and checkpoint number:
sim = jaxion.Simulation("checkpoints/", checkpoint_number=i)
Once the simulation is loaded, the fields can be accessed from the sim.state object.
Jaxion also provides built-in functions to help with analysis and post-processing.
For example, to compute the radially-averaged power spectrum of the fuzzy dark matter density field, do:
rho_dm = jnp.abs(sim.state["psi"]) ** 2
box_size = sim.box_size
kx, ky, kz = sim.kgrid
Pf_dm, k, _ = jaxion.radial_power_spectrum(rho_dm, kx, ky, kz, box_size)
As an example, see examples/heating_gas
which has an analyze.py script that creates the power spectrum plot shown below:
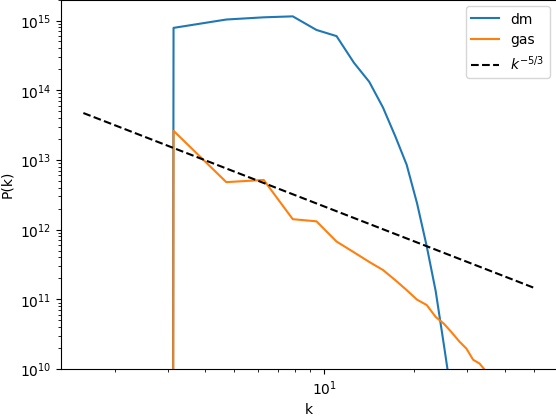
for the simulation of gas heating by fuzzy dark matter substructure:
